Global Malaise Trap Program

Large-Scale Sampling for Worldwide Biodiversity Assessments

Our Mission

Develop and standardize protocols for the acquisition and analysis of detailed temporal and spatial information on terrestrial arthropod communities across the globe

Right: From 2015 to 2017, Malaise traps were deployed in 158 sites across 33 different countries around the world, collecting over 2M specimens and generating DNA barcode sequences for over 150K species.

Overview

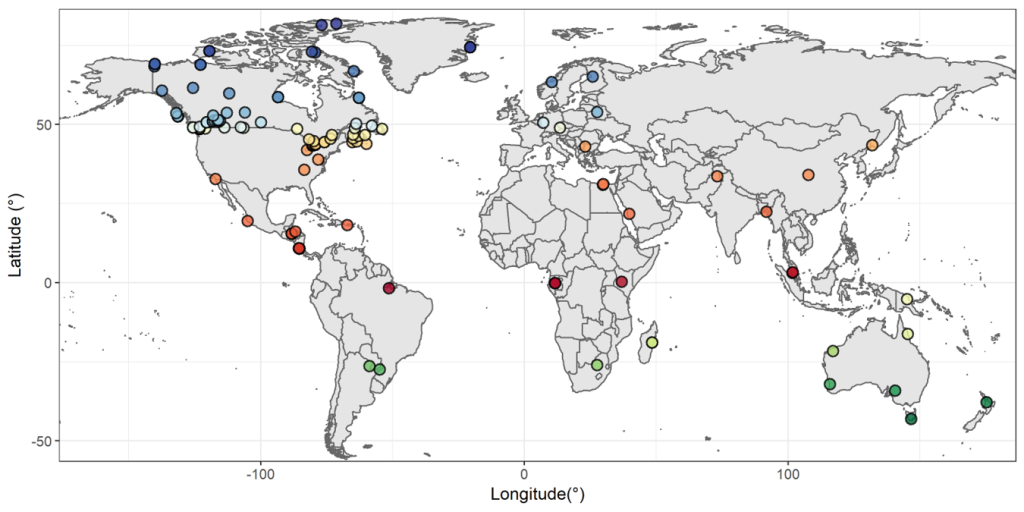
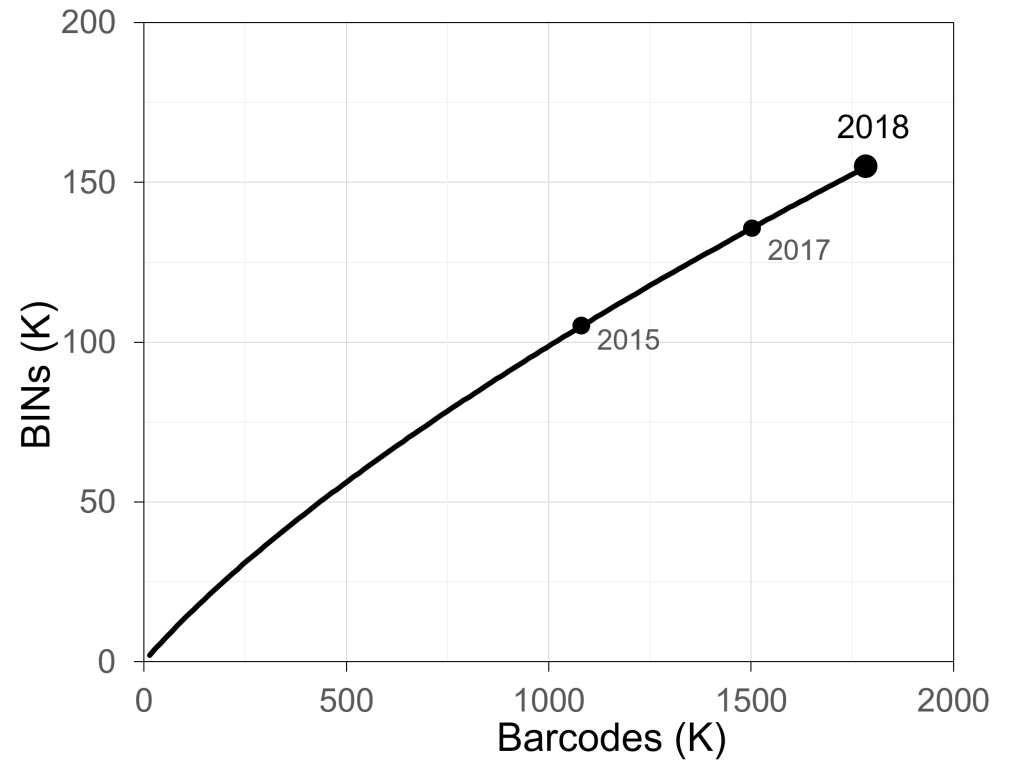
The Global Malaise Trap Program (GMP) was an international collaboration between the CBG and multiple contributors from around the world. Results from the Canadian National Parks (CNP) Malaise Program were incorporated into the larger GMP dataset leading to a total of 158 sampling sites across 33 countries. The program represented the first step toward the acquisition of detailed temporal and spatial information on terrestrial arthropod communities across the globe. Over 2M specimens were sequenced through the GMP, representing over 153K species.
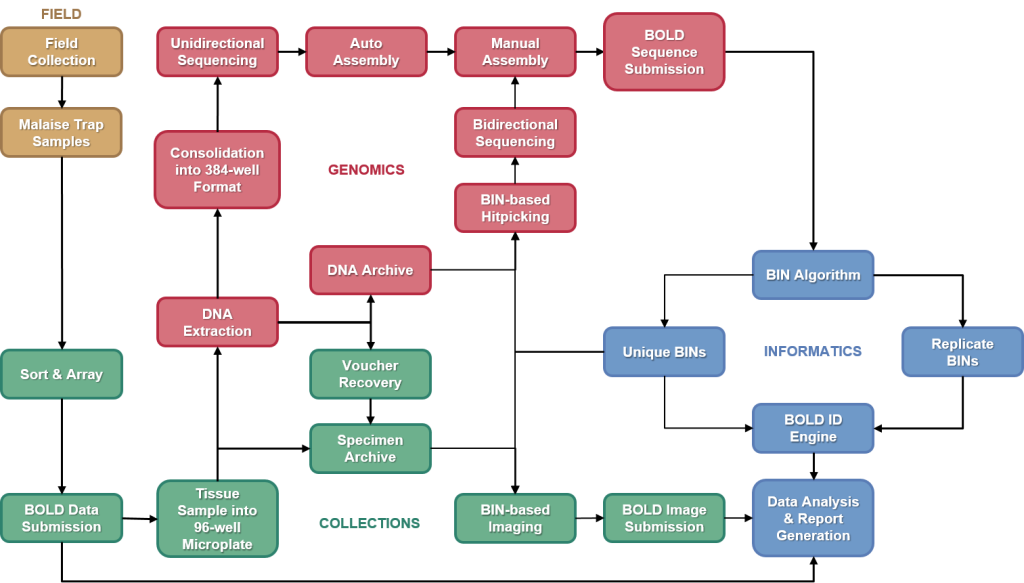
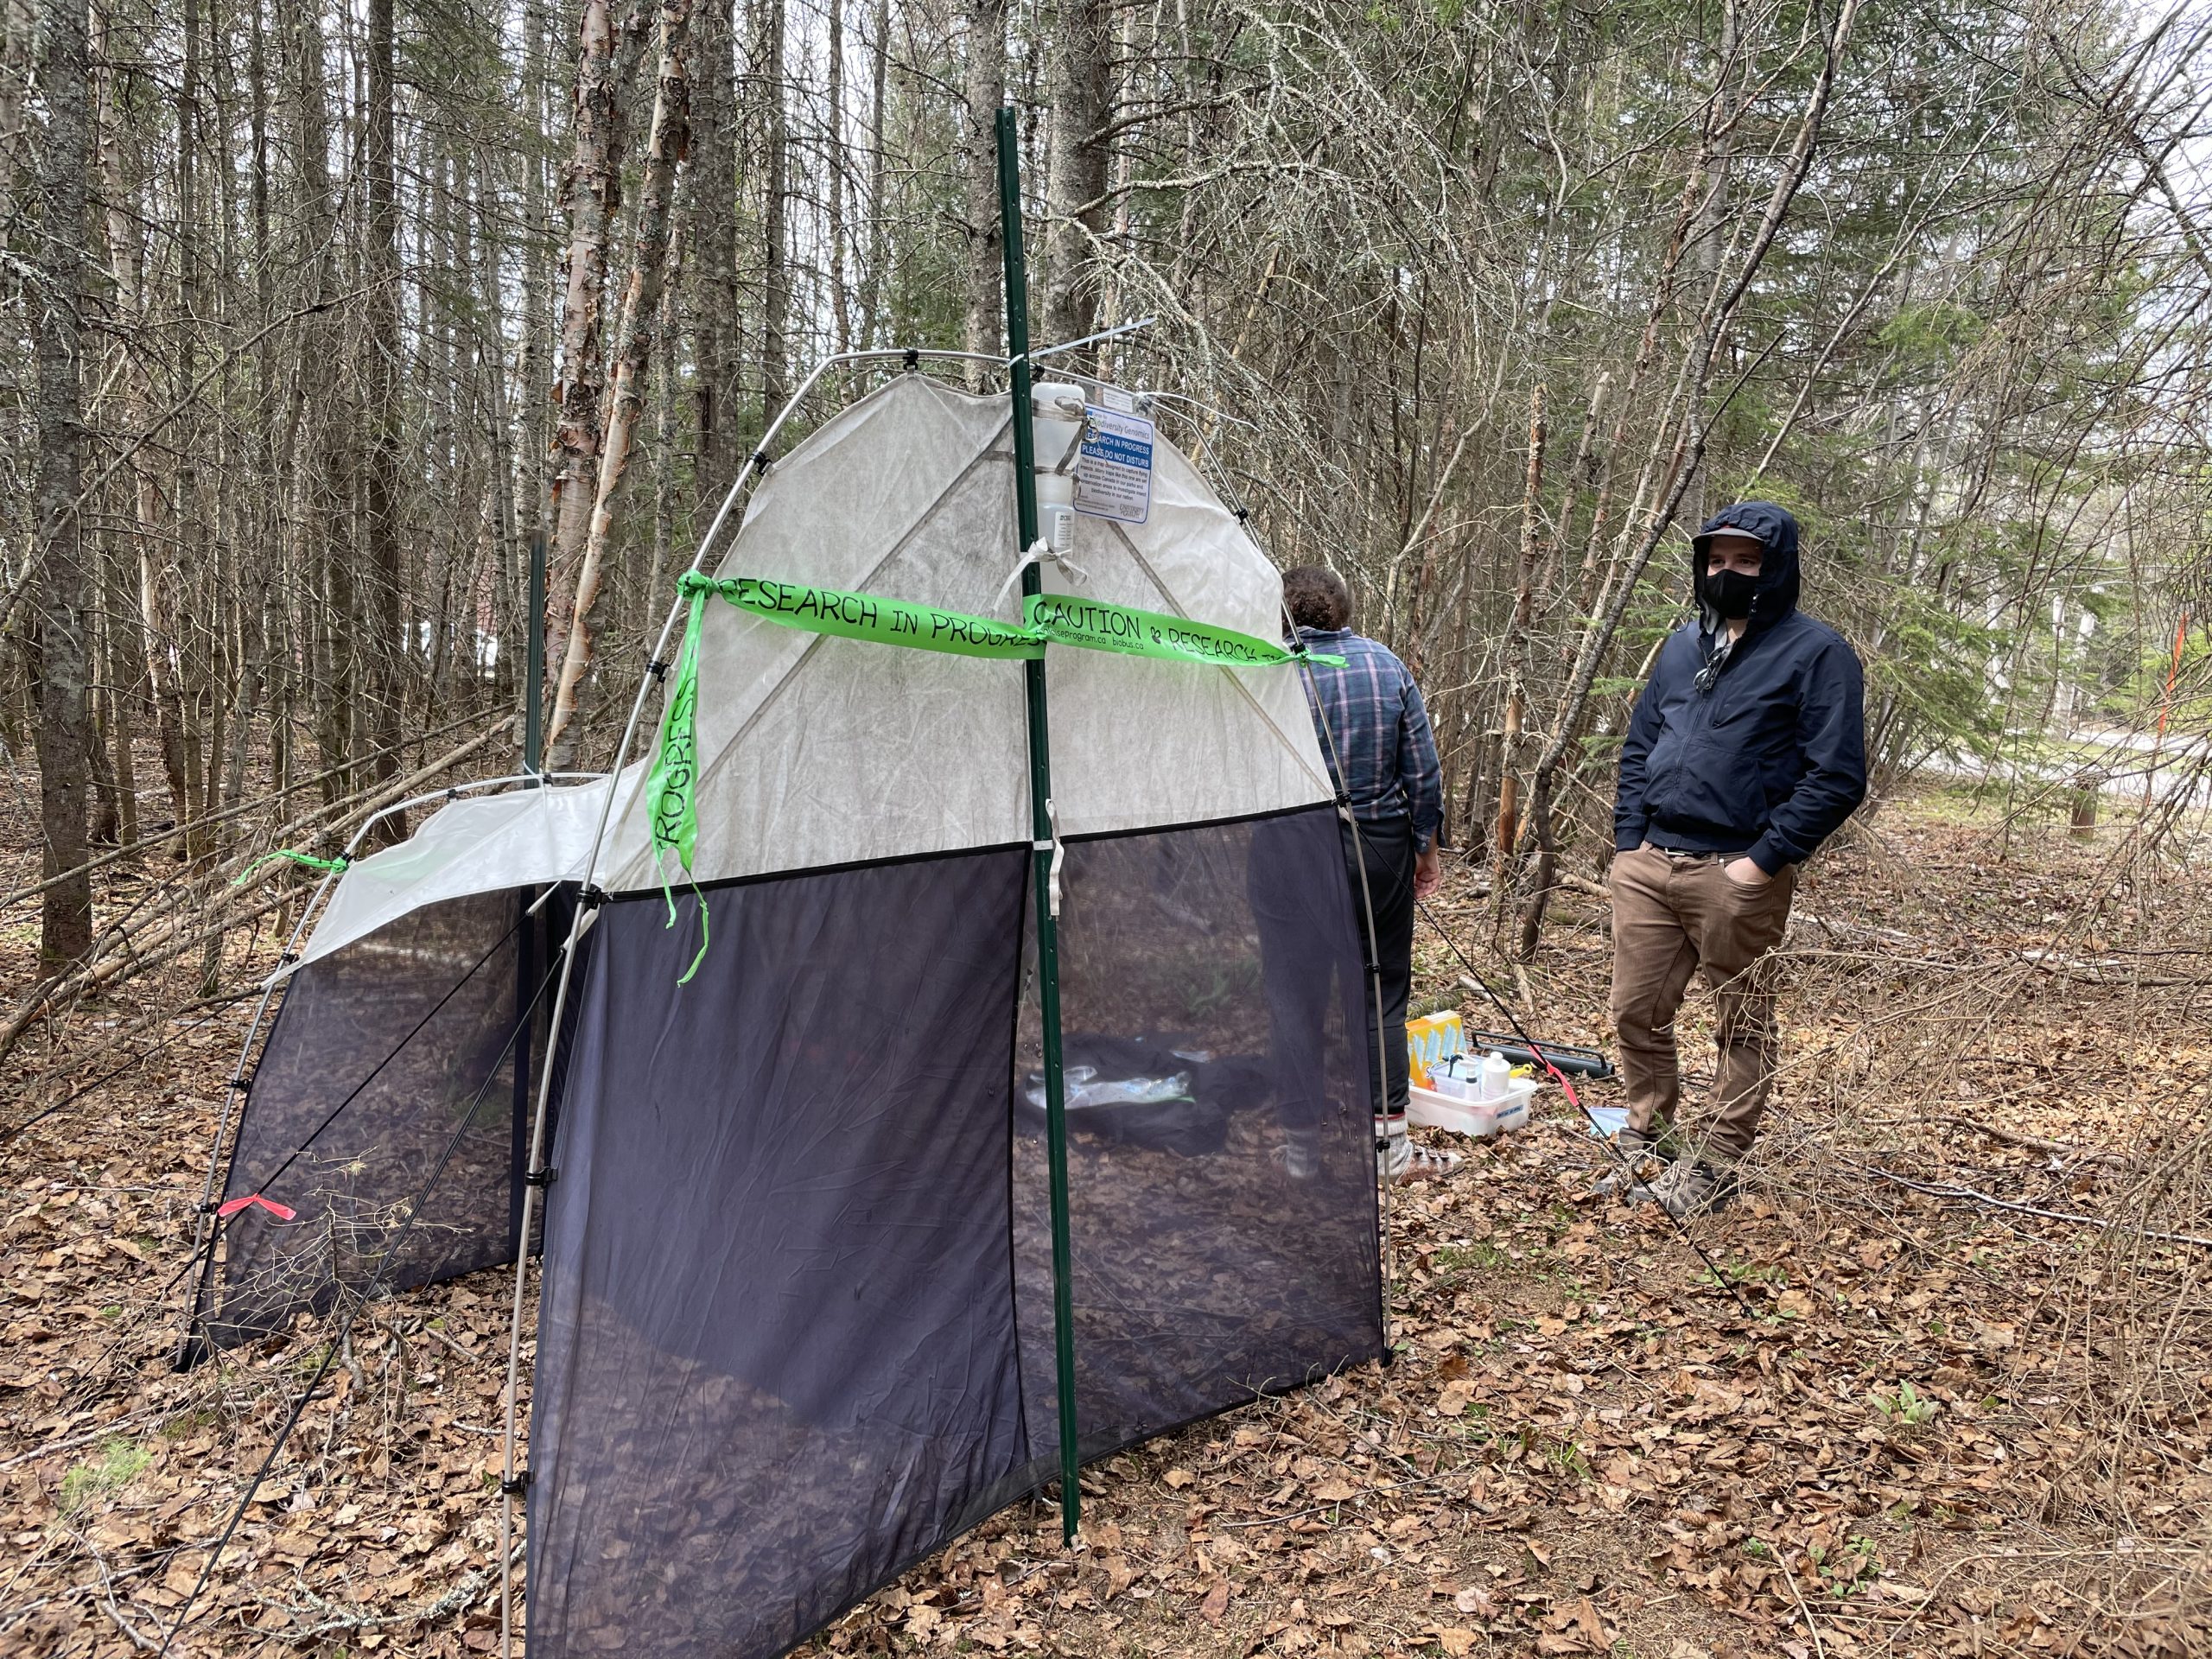
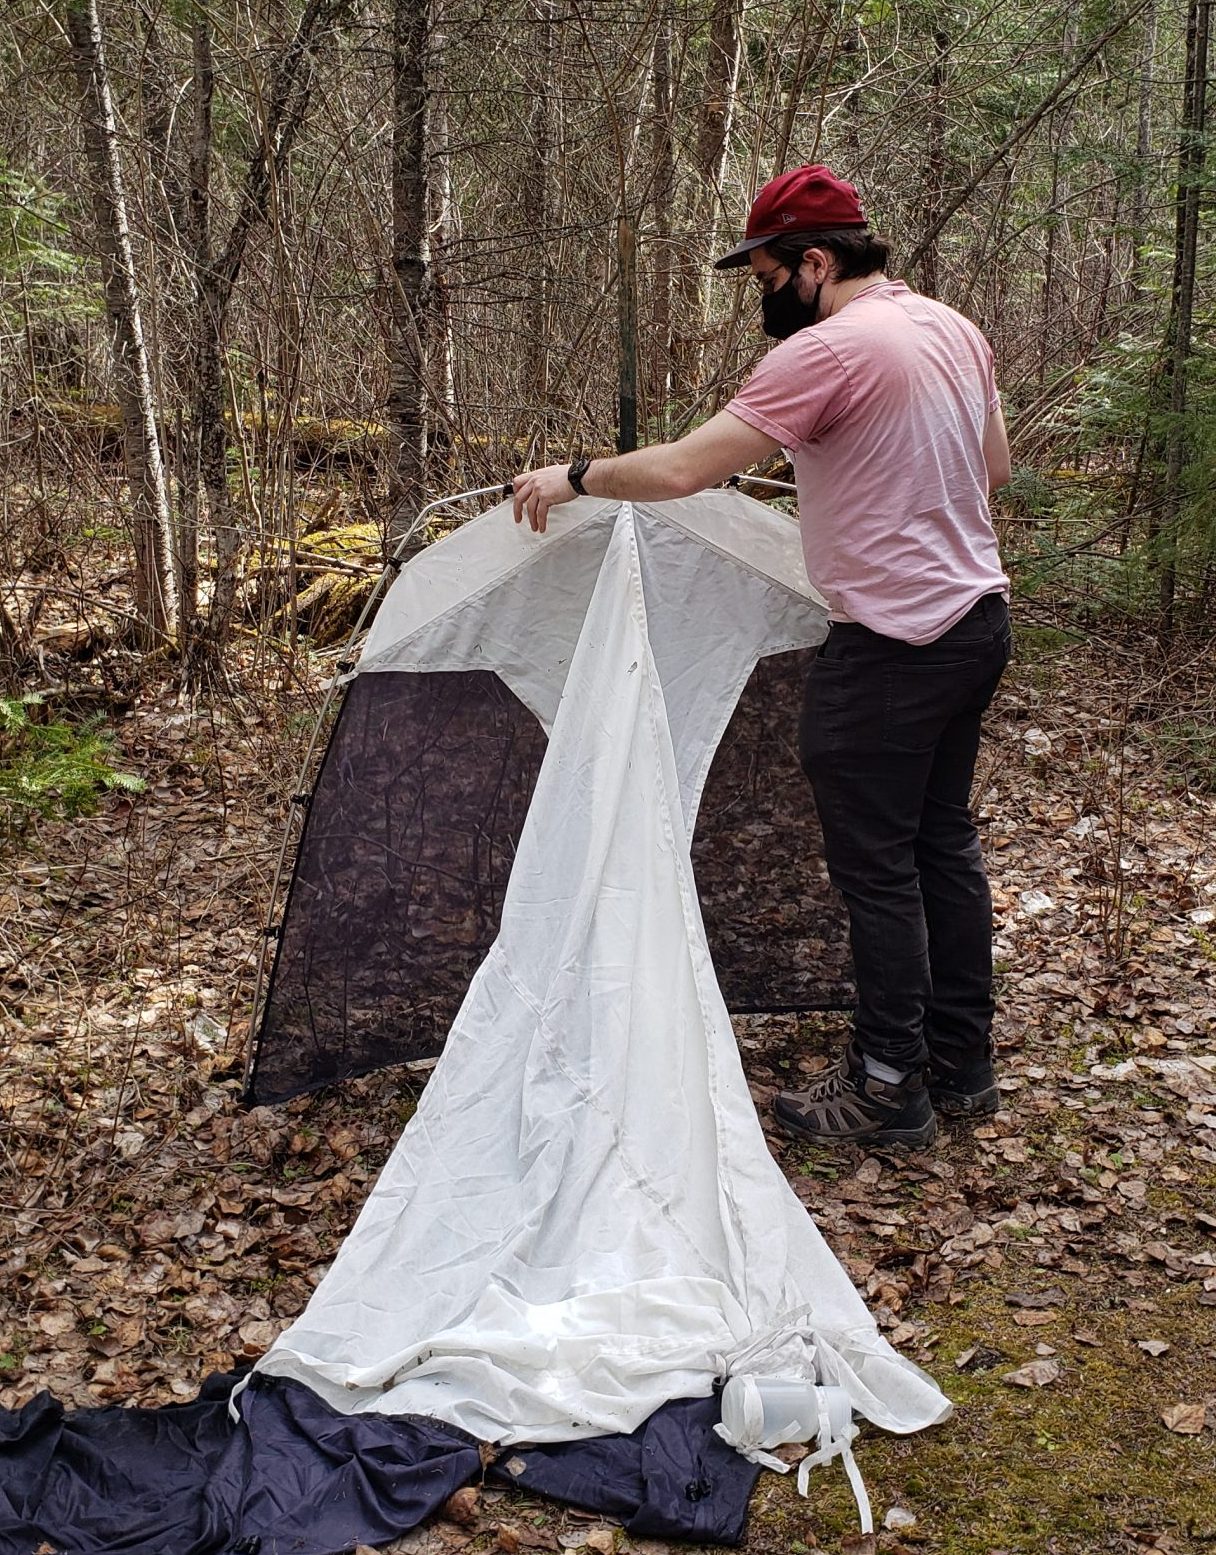
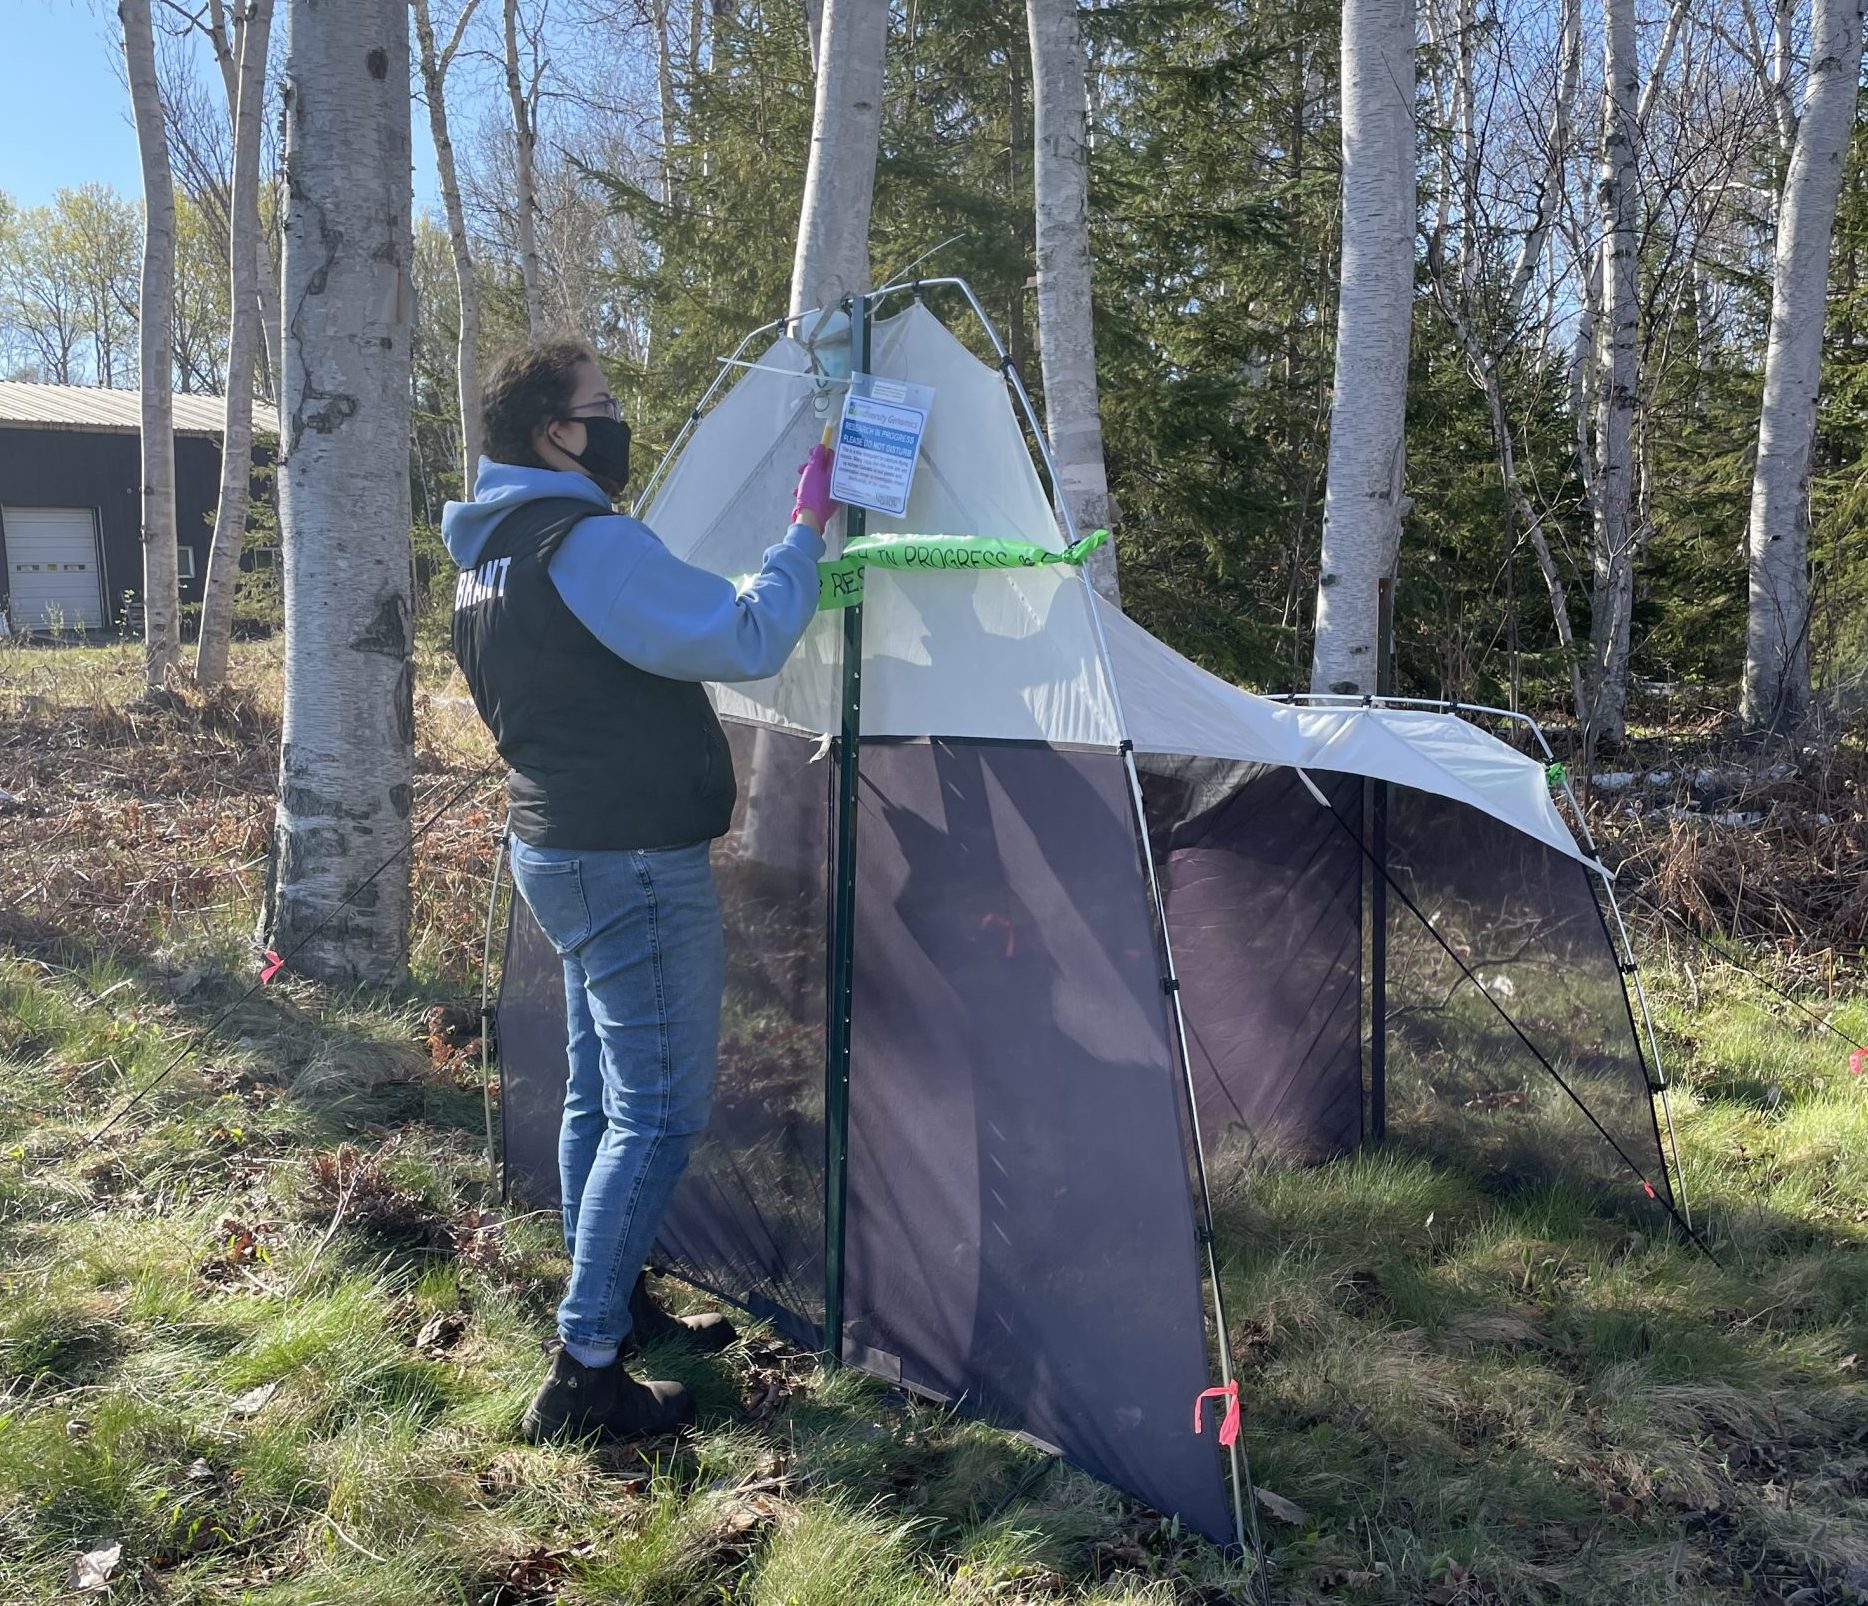
Past efforts to include arthropods in terrestrial assessments faced two barriers: ineffective sampling due to habitat complexity, and unreliable tools for species identification. The second barrier was circumvented by DNA barcoding, a method that utilizes sequence variation in a standardized gene fragment to rapidly sort and objectively differentiate species, while the first barrier was surmounted by the use of Malaise traps as specimen collection tools. Malaise traps are tent-like structures that are effective at capturing insects from various groups and are easily deployed and cost-effective. Used in combination with DNA barcoding, this approach made it possible to carry out large-scale sampling programs and enabled a time- and cost-efficient approach for biodiversity assessments around the world.

Project Outcomes (September 2018)

Sampling Sites

A map of the world in grey with coloured dots representing sampling locations for the Global Malaise Program

Results

130 SITES PROCESSED

TOTAL SPECIMENS = 2,082,406

RECORDS WITH BINS = 1,771,353

BINS = 153,988

Complete Global Malaise Program species accumulation curve for all of the 130 sites completed as of September 2018, indicating progress through 2015 (69 sites completed) and 2017 (117 sites completed).

Complete GMP species accumulation curve for all of the 130 sites completed as of September 2018, indicating progress through 2015 (69 sites completed) and 2017 (117 sites completed).

Species accumulation curve for each of the 130 sites. Solid line segment represents the rarefaction curve, the dashed line segment extrapolates the curve to double the observed sample size. Colours indicate a gradient in latitude with blue shades in the Northern hemisphere, red shades near the equator, and green shades in the Southern hemisphere.
Variation among sites in observed BIN diversity with latitude (P<0.001 and r2=0.80). The size of points indicates the number of specimens. The P and r2 values reflect overall model statistics while the regression line indicates the significant effect of latitude.

Variation among sites in observed BIN diversity with latitude (P<0.001 and r2=0.80). The size of points indicates the number of specimens. The P and rvalues  reflect overall model statistics while the regression line indicates the significant effect of latitude.

Standard Protocol

CBG provides a standard sampling kit to all GMP participants. This includes a brand new Townes style Malaise trap and typically a year’s worth of collection bottles. Partners provide ethanol for killing and preserving samples and are responsible for changing the collection bottle once every week for the duration of the flight season.

All collection bottles are shipped for subsequent processing at CBG. Samples are accessioned, specimens were identified to order, arrayed, labeled, databased, and tissue-sampled for genetic analysis. All arthropods are barcoded, with the exception of a few very common species of Collembola, where only a few individuals from each trap sample were analyzed. Standard barcoding protocols are followed to recover the barcode region of cytochrome c oxidase subunit I (COI) gene. The barcode sequences, specimen images and collateral data are uploaded to BOLD under the ‘Global Malaise Program’ campaign. Barcoded specimens are assigned to an existing or new Barcode Index Number (BIN), a proxy for a formal Linnean species name, as outlined by Ratnasingham & Hebert (2013). Identifications are assigned by the BOLD-ID Engine where possible, allowing preliminary species inventories to be completed for each location and facilitating comparisons among them.

Reports are generated upon completion of analysis for a single GMP site. They include a taxonomy list, image library, neighbor-joining tree, and different comparisons with other analyzed GMP locations. The whole program moves forward through collaborative efforts where each country is creating a species inventory and barcode library for itself but shared BINs between countries therefore allow for concurrent identifications between collections.

A workflow diagram showing the pipeline from specimen acquisition through processing, DNA sequencing, BIN assignment, and Data Reporting.

Global Malaise Trap Program – Developing the standard for worldwide terrestrial arthropod biodiversity monitoring